Numbers are sourced from multiple places, including verified subreddits and data submitted by author communities, and reflect the performance of new authors publishing stories on Amazon KDP between 2020 and 2025.
Introduction: The Invisible Tipping Point
If you spend any time in author communities, you’ve heard the advice ad nauseam: “Just keep writing. The money is in the backlist.”
But for a new author sitting at Book 15 and seeing $40 in monthly royalties, that advice can feel demoralizing. It feels like you are shouting into the void.
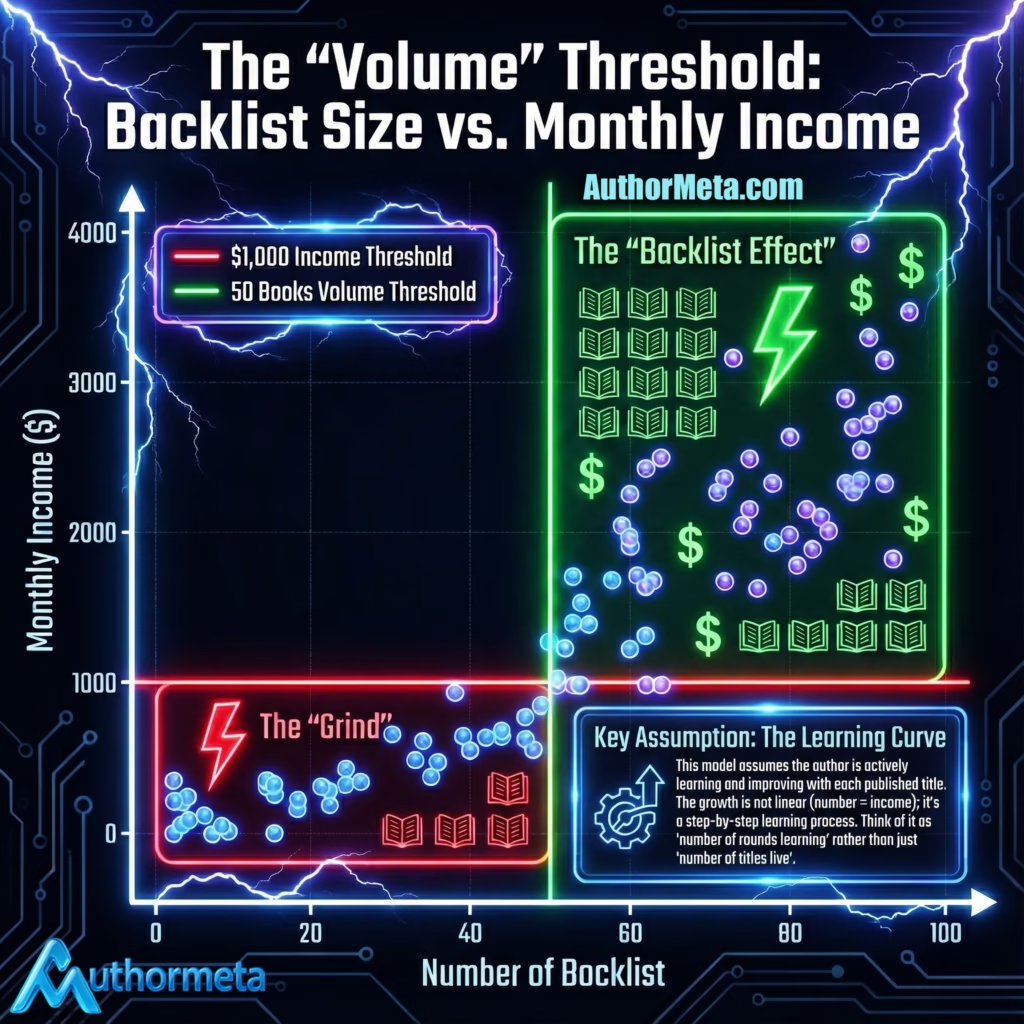
I created the visualization above to map out exactly what is happening during those early stages. It illustrates the relationship between Backlist Size and Monthly Income, specifically for high-volume genres like Romance and Erotica.
As you can see, the path is a game of two distinct zones.
Zone 1: The “Grind” (0–50 Books)
The Red Zone in the chart represents the “Grind.” This is the period where most authors quit.
Statistically, it is normal for income to remain stubborn during your first few dozen releases. You might hover under the $1,000/month mark despite working incredibly hard. Why?
- Algorithm Obscurity: You don’t have enough data points for the recommendation engines to know who your ideal reader is.
- Zero Read-Through: With a small catalog, you can’t maximize “sell-through.” If a reader loves Book 1, they have nowhere else to go.
- The “Trust” Gap: Readers are hesitant to invest time in an author with only a handful of titles.
In this phase, you are buying data and making a bit of pocket change.
Zone 2: The “Backlist Effect” (50+ Books)
The Green Zone is where the magic of compound interest kicks in. Notice how the data points start to scatter upward, breaking away from the baseline?
This is the Backlist Effect. Once you cross a certain volume threshold (approximated here as ~50 books, though it varies by niche), your old work starts working for you. A new release is a marketing event that drags new readers into your entire funnel.
Suddenly, you aren’t fighting for every single sale. Your backlist is generating income while you sleep.
The Critical Caveat: Volume vs. Learning
Here is the most important part of this entire graph… and the part most authors get wrong.
The X-Axis is more than simply “Number of Files Uploaded.” It is “Number of Rounds of Learning.”
If you publish 100 books but never improve your cover design, never tighten your blurbs, and never study your negative reviews, you will stay in the Red Zone forever.
This chart assumes that Book 50 is significantly better than Book 1.
- Books 1–10: You are learning to finish a story.
- Books 11–30: You are learning market expectations and tropes.
- Books 31–50: You are mastering packaging, keywords, and hooks.
The exponential growth you see in the Green Zone is a multiplier of Skill x Volume. Volume alone is just noise. Volume plus Iterative Learning is a career.
The Takeaway
If you are currently in the “Grind” phase, look at the chart. You aren’t failing; you are simply in the accumulation phase. Treat every book as a “Round of Learning.” Improve one thing… your cover, your blurb, your pacing… with every single release.
The tipping point is there. You just have to build the bridge to reach it.